📚 New Blog Posts
1. This Month in Process Manufacturing – February 2026
3. The Reality of Lot Traceability in Process Manufacturing
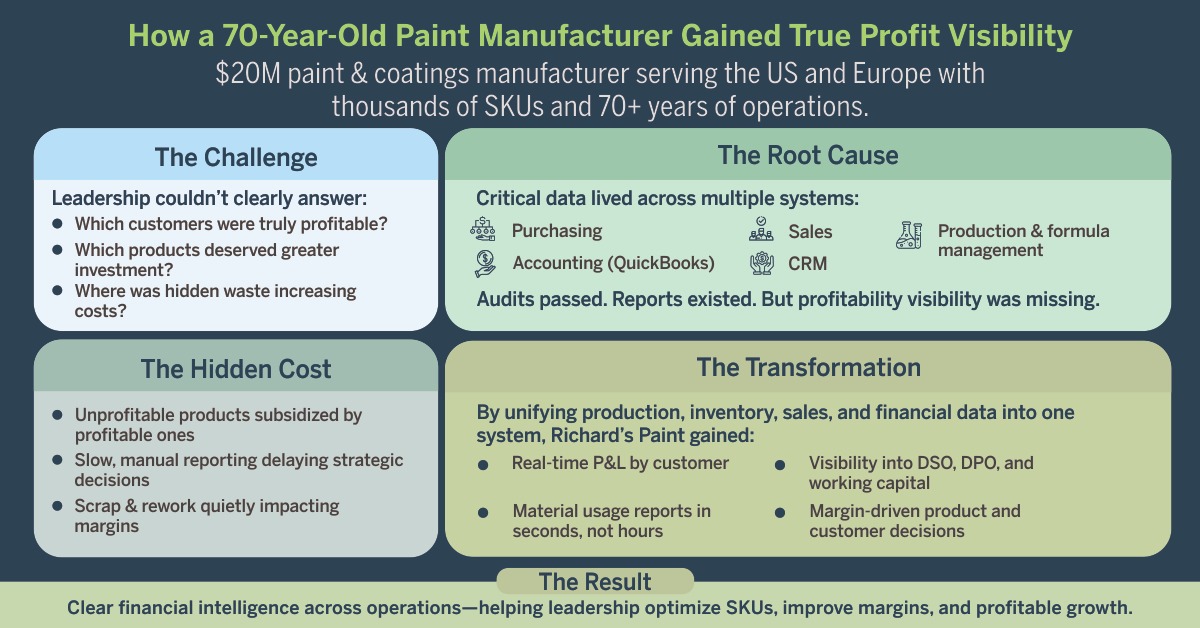
Richard’s Paint had a problem that wouldn’t show up on any audit: they were making money, but they had no idea where.
For 70 years, the paint and coatings manufacturer operated profitably across thousands of SKUs, serving customers from the United States to Europe. They passed their audits. They met specifications. But when leadership asked basic financial questions, “Which customers are actually profitable?” “Which product lines should we invest in?” “Where are we losing money to inefficiency?” The answers required days of manual work, if they could be answered at all.
“We had a black hole of data,” their leadership recalls. “The information was there, but it was scattered across so many systems that pulling it together to make decisions was extremely difficult.”
The problem wasn’t quality or compliance in isolation. The problem was that quality data lived in one system, sales data in another, financial data in a third, and production data in a fourth. Each piece passed its own audit. But together, they created a blindness that was costing the company money on every single batch.
This is the hidden cost of fragmented systems: you can be compliant and still be unprofitable. You can pass every audit while subsidizing money-losing products with profitable ones. You can meet every specification while accepting waste as “just how this process works.”
The manufacturers who are winning haven’t just improved their quality processes. They’ve unified their data architecture and, in doing so, turned compliance from a cost center into a profit driver.
The Visibility Gap You’re Not Measuring
Here’s the uncomfortable reality: most manufacturers operate with perfect compliance and zero financial visibility. They can document every batch, prove every procedure was followed, and pass every audit. But they can’t answer the most basic business question: “Are we making or losing money on this product?”
The problem is that quality, production, sales, and financial data live in separate worlds. And when data is disconnected, accountability is impossible.
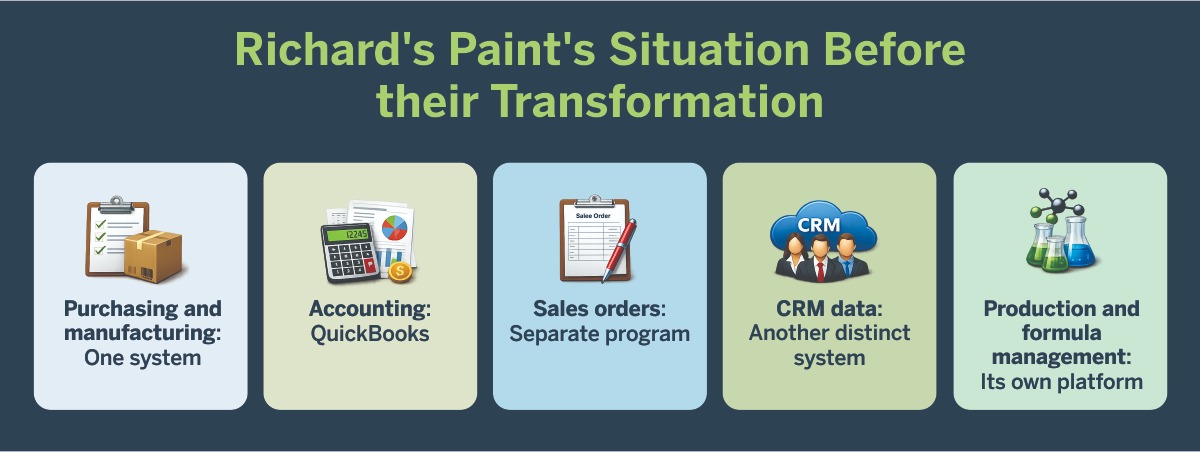
Consider Richard’s Paint’s situation before their transformation:
- Purchasing and manufacturing: One system
- Accounting: QuickBooks
- Sales orders: Separate program
- CRM data: Another distinct system
- Production and formula management: Its own platform
Each system functioned. Each generated reports. Each passed audits. But leadership couldn’t connect the dots. They couldn’t tie profit and loss to customers. They couldn’t identify which of their thousands of formulations were driving margin versus just consuming resources. Material usage reports took over an hour to run, meaning by the time they had the data, the opportunity to act on it was long gone.
This is what “passable” quality actually costs: not just the scrap and rework you can measure, but the strategic decisions you can’t make because your data lives in silos.
The Hidden Tax of Financial Invisibility
Let’s talk about what this invisibility actually costs. A mid-sized manufacturer producing 500 batches annually with a conservative 3% scrap rate and 5% rework rate isn’t just losing product; they’re losing the raw materials, labor, energy, equipment time, and opportunity cost of that production capacity. For many operations, that’s $500,000 to $2 million in annual costs that simply evaporate.
But here’s the more insidious cost: you’re subsidizing unprofitable products with profitable ones, and you don’t know which is which.
When you can’t tie P&L to specific customers, product lines, and SKUs, you’re making strategic decisions in the dark. Which products should you invest in? Which should you rationalize? Which customers are worth the overhead of custom formulations? You’re guessing. And guessing is expensive.
Richard’s Paint lived this reality for years. They had revenue data. They had cost data. But no way to connect them with the granularity needed to drive profitable decisions. They were compliant, operational, and strategically blind.
The manufacturers who are winning don’t just have better quality processes. They have unified visibility: production data flows into inventory, inventory flows into sales, sales flows into financials, and every batch can be traced from raw material cost to customer profitability. This isn’t just cleaner reporting, it’s a fundamentally different way of running the business.
The Five Questions That Reveal Your Visibility Gap
Before we go further, here’s a diagnostic. Answer these five questions honestly:
1. Can you generate a P&L statement by customer within 60 seconds?
- If not, you’re making customer investment decisions without understanding customer profitability.
- Richard’s Paint couldn’t answer this before their transformation. They had sales data and cost data, but connecting them required hours of manual work.
2. Do you know which product lines are subsidizing which others?
- If your costing is averaged across products, you’re hiding losses inside your winners.
- Unified systems allow you to track actual costs, raw materials, labor, overhead, waste, and individual SKUs, revealing true profitability.
3. Can your leadership team see real-time production, inventory, and financial data in one dashboard?
- If executives need to request reports from three different departments to understand business performance, decisions are always delayed and often wrong.
- Richard’s Paint now has “comprehensive dashboards and real-time reporting” where “decisions that once required hours of manual data gathering can now be made instantly.”
4. When a quality issue occurs, can you immediately see the financial impact?
- If you can document the deviation but not quantify the cost, you can’t prioritize what to fix.
- Integrated systems connect quality events to material costs, labor hours, and customer commitments automatically.
5. Do you measure Days Sales Outstanding, Days Payable Outstanding, and Net Working Capital with real-time accuracy?
- These are the financial health metrics that determine cash flow and operational efficiency.
- Richard’s Paint now has “deep insights into real financial health and business performance, such as P&L by Customer, Net Working Capital, Days Sales Outstanding, Days Payable Outstanding, and other key financial metrics.”
If you answered “no” to three or more of these questions, you’re operating with fragmented visibility. And it’s costing you more than you think.
Unified Visibility: Richard’s Paint Transformation
When Richard’s Paint made the strategic decision to migrate to an integrated ERP platform, they weren’t just consolidating software. They were eliminating the financial blindness that had cost them profitability for years.
Director of Operations David Ecker describes the shift: “Combining the functionality of BatchMaster with SAP Business One meant we could have one source of truth for everything, from purchasing raw materials to final sales and financial reporting.”
One source of truth. That’s not a software feature, it’s a financial strategy.
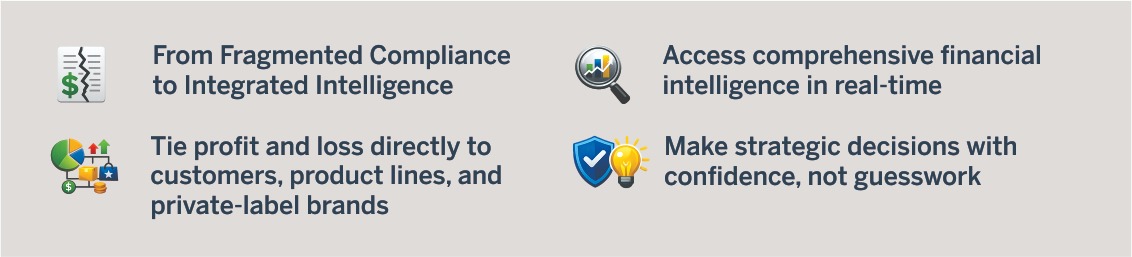
From Fragmented Compliance to Integrated Intelligence
Before: Multiple systems, each generating compliant but disconnected data
After: Unified platform where every transaction flows through production, inventory, sales, and financials automatically
The result wasn’t just easier reporting. It was “a clear line of sight into the true drivers of profitability.” For the first time, leadership could:
Tie profit and loss directly to customers, product lines, and private-label brands
- This enabled them to identify which products to rationalize based on actual profitability, not just revenue
- They could determine where to optimize batch sizes to improve margins
- They could align resources with genuinely profitable opportunities instead of just busy ones
Access comprehensive financial intelligence in real-time
- P&L by Customer: instant visibility into which relationships generate margin
- Net Working Capital: real-time understanding of cash tied up in operations
- Days Sales Outstanding: immediate alerts when receivables slow
- Days Payable Outstanding: strategic leverage in supplier negotiations
- Material Usage Visibility: from over an hour to 20 seconds
These aren’t just reports, they’re live KPIs tracked through integrated dashboards. Because all data flows through a single ERP system, Richard’s Paint can monitor the metrics that actually drive profitability without manually compiling data. Production efficiency, material yield, customer profitability, working capital turns; every KPI updates automatically as operations happen.
Make strategic decisions with confidence, not guesswork
- “Using item and customer properties for analysis takes the guesswork out of decisions,” notes Ecker. “We can move faster and with more confidence.”
- Product rationalization became data-driven: eliminate SKUs that consume resources without generating profit
- Batch sizing optimization became precise: reduce excess inventory while maintaining service levels
- Customer investment became strategic: focus on relationships that drive profitable growth
The Compound Effect of Unified Data
When production data flows directly into financial reporting, something remarkable happens: quality improvements automatically become margin improvements.
- Reduced scrap and rework → Immediate impact on cost of goods sold
- Optimized batch sizes → Lower inventory carrying costs, better working capital
- Automated compliance safeguards → Eliminated risk of costly regional violations
- End-to-end traceability → Faster root cause analysis, preventing repeat waste
Richard’s Paint didn’t just get better reporting. They gained “the visibility, efficiency, and control needed to keep growing” in a competitive market where operational efficiency determines who wins.
As their leadership puts it: “We are without a doubt a better company than we were before.”
The Scrap Rate You’re Not Measuring
The most expensive scrap is the kind that never gets categorized as scrap. It’s the yield loss built into your standard operating procedures. It’s the extra processing time you’ve normalized. It’s the material overconsumption you’ve factored into your cost models.
When your plant manager says “that’s just how this process works,” what they’re really saying is “we’ve accepted financial losses as inevitable.” But, inevitably, according to what? Last quarter’s performance? Last year’s audit?
Organizations with proactive compliance systems know their theoretical maximum yield, and they measure the gap between that and actual performance not quarterly, not monthly, but in real-time. Every point of deviation isn’t a future compliance risk; it’s current financial underperformance.
How to Build Unified Visibility: Lessons from the Field
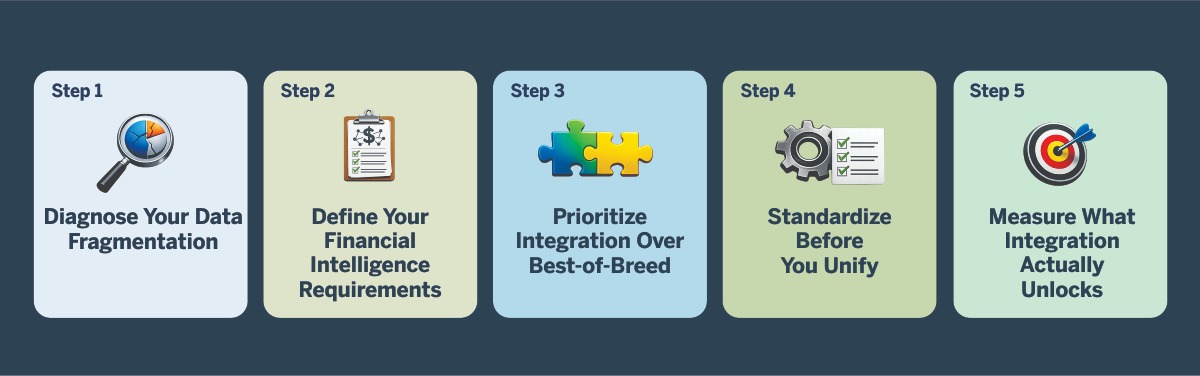
The manufacturers who successfully eliminate financial blindness follow a clear pattern. Here’s what Richard’s Paint learned, and what you can apply to gain the visibility that drives profitability:
Step 1: Diagnose Your Data Fragmentation
Richard’s Paint’s transformation began with brutal honesty: they had purchasing in one system, accounting in another, sales in a third, and production in a fourth. Each functioned independently. Together, they created strategic blindness.
Your action this week: Map your current data architecture. List every system that touches production, quality, inventory, sales, or financials. Now try to answer: “What was the actual cost, including waste, rework, and overhead, of the batch we produced yesterday, and what customer will it be sold to?” If the answer requires pulling data from three or more systems and doing manual calculations, you have a fragmentation problem.
Step 2: Define Your Financial Intelligence Requirements
Before Richard’s Paint selected their solution, they identified what decisions they needed to make better:
- Product rationalization based on profitability, not just revenue
- Customer investment prioritization based on margin, not just volume
- Batch sizing optimization based on actual carrying costs
- Working capital management with real-time visibility
Your action this week: List the top five strategic decisions your leadership team needs to make in the next six months. For each one, identify what financial data would make that decision obvious instead of debatable. If you can’t access that data within an hour, you need better visibility.
Step 3: Prioritize Integration Over Best-of-Breed
The old strategy was “best-of-breed”: buy the best accounting system, the best production system, the best sales system, and integrate them with middleware. Richard’s Paint learned that this creates permanent complexity.
The new strategy is “unified visibility”: accept that 90% functionality in a fully integrated platform beats 100% functionality in disconnected systems.
As their leadership notes: “Combining the functionality of BatchMaster with SAP Business One meant we could have one source of truth for everything, from purchasing raw materials to final sales and financial reporting.”
Your action this week: Calculate the total cost of your current integration layer, middleware licenses, custom development, IT support hours, and the opportunity cost of delayed reporting. Compare that to the cost of a unified platform. The math is usually sobering.
Step 4: Standardize Before You Unify
Richard’s Paint did something unglamorous but essential: they cleaned and standardized their product numbering system before migration. They classified products with detailed properties. They mapped current workflows against target workflows.
Their advice: “Clean up your data before you start, map out both your current and future processes, think carefully about how products are classified, and be open to rethinking how work gets done.”
Your action this week: Pick your highest-volume product category. Audit whether you have consistent, machine-readable attributes for cost drivers, quality specifications, and customer requirements. If your data structure can’t support automated financial analysis, your unified system won’t deliver unified intelligence.
Step 5: Measure What Integration Actually Unlocks
Richard’s Paint measures success by business outcomes, not system uptime:
- Speed to insight: Material usage reports from >1 hour to 20 seconds
- Decision confidence: “Takes the guesswork out of decisions.”
- Financial intelligence: Real-time P&L by customer, DSO, DPO, Net Working Capital
- Strategic clarity: Data-driven product rationalization and resource allocation
Your action this week: Identify one decision that currently requires manual data gathering from multiple systems. Calculate how much that decision costs in labor hours and decision delay. That’s your ROI baseline for unified visibility.
The Real Cost of “Passable”
“Passable” quality has a compounding cost structure that most financial analyses miss. It’s not just the immediate loss of materials and labor. It’s the capacity you can’t use because you’re reproducing failed batches. It’s the customer relationships that gradually erode because your product is technically compliant but inconsistently optimal. It’s the innovation capacity your quality team lacks because they’re busy preparing for audits rather than improving processes.
Most painfully, it’s the competitive disadvantage you’re accepting. While you’re celebrating compliance, your competitors are using the same data streams to drive down costs and increase margins. They’re not “passing” audits; they’re making audits irrelevant because their process is so tightly controlled that compliance is a natural byproduct of efficiency.
Your Next Decision
Right now, your leadership team is making strategic decisions about which products to invest in, which customers to prioritize, and which processes to optimize. Are those decisions based on unified financial intelligence, or on disconnected data that requires hours of manual reconciliation?
Richard’s Paint faced this question after 70 years in business. Their answer was to eliminate the fragmentation that created financial blindness. As their leadership puts it: “If you think you can plug in an end-to-end ERP and run your business the same way you do today, you’re missing the point. The goal is to transform how you operate.”
The financial leak isn’t the occasional quality failure. It’s the strategic decisions you make blindly because your data lives in silos.
Here’s what unified visibility actually unlocks:
Financial Intelligence
- P&L by customer, product line, and SKU in real-time
- Net Working Capital, DSO, DPO tracked continuously
- True profitability (not just revenue) driving resource allocation
Decision Confidence
- Product rationalization based on data, not opinion
- Customer investment prioritized by margin, not volume
- Batch optimization aligned with actual carrying costs
Operational Efficiency
- Quality improvements automatically impacting COGS
- Waste reduction flowing directly to the bottom line
- Compliance embedded in workflow, not added as overhead
You have three choices:
- Maintain your current architecture. Continue generating compliant reports from disconnected systems while making strategic decisions based on gut feel and delayed data.
- Add more integration layers. Invest in middleware and custom development to connect your systems, creating permanent complexity and ongoing IT overhead.
- Build unified visibility. Migrate to an integrated platform where production, quality, inventory, sales, and financials flow through a single source of truth, enabling the financial intelligence that drives profitable growth.
Only one of these options positions you to compete in a market where data-driven decision-making is the price of entry.
The question isn’t whether you’ll pass your next audit. The question is: how much profit are you leaving on the table because you can’t see where you’re actually making money?