As process manufacturers grow into the $10–$50M revenue range, the way performance is measured starts to matter more than performance alone.
At this stage, enterprise value is no longer abstract. It becomes measurable, improvable, and defensible. Buyers, lenders, and private equity firms stop asking whether the business is growing and start asking how it is growing.
Are margins expanding or quietly eroding?
Is cash being generated or trapped in working capital?
Is growth creating scalable earnings or operational strain?
These questions are answered long before a transaction ever begins. They show up in a focused set of KPIs that signal earnings quality, cash discipline, and growth efficiency.
This is Part 1 of a two-part blog series designed for $10–$50M process manufacturers. It focuses on the KPIs that grow enterprise value, the metrics buyers rely on to assess profitability, cash flow, and scalability before assigning a valuation multiple.
These are the KPIs that shape valuation conversations long before a deal is on the table. Before we delve into the KPIs that grow enterprise value, let’s first understand the importance of KPIs.
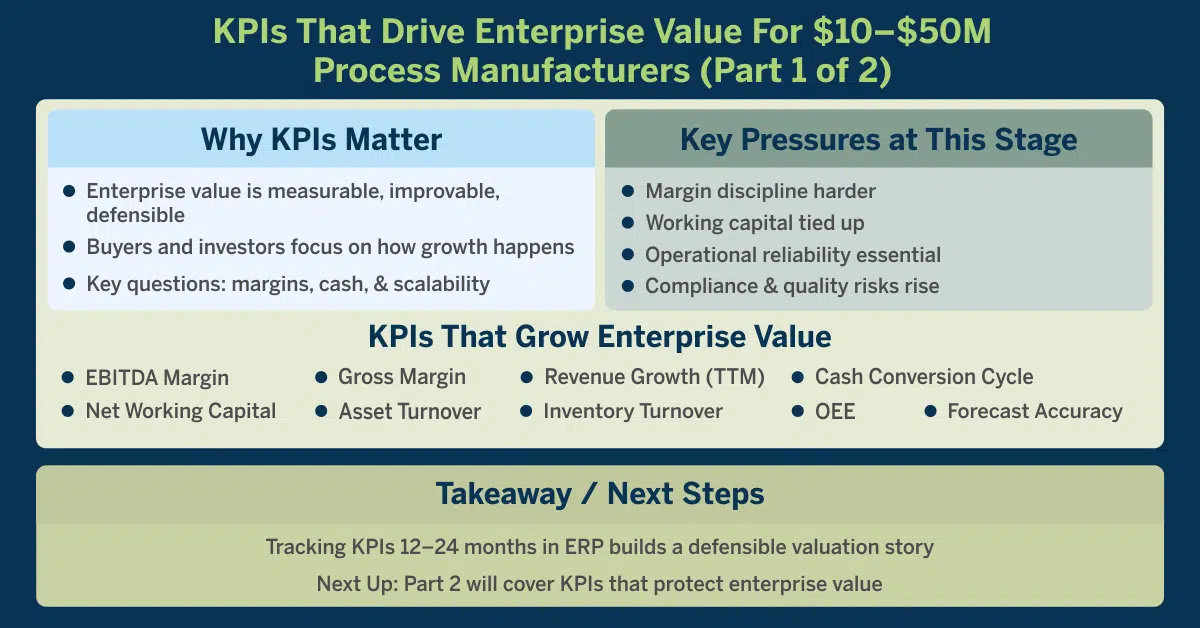
Why KPIs Matter at Your Growth Stage
As a process manufacturer grows from $10M to $50M in revenue, performance and valuation become tightly linked.
- Margin discipline becomes harder as material, labor, and overhead costs fluctuate
- Working capital gets tied up in growing inventory and slower receivables
- Operational reliability becomes essential as larger customers demand consistency
- Compliance and quality risks increase with production complexity
- Enterprise value becomes measurable and improvable
At this stage, enterprise value is no longer abstract but it’s measurable, improvable, and defensible.
Buyers, lenders, and private equity firms look for more than growth. They look for evidence that the business can grow enterprise value through earnings and cash flow, and protect that value by controlling risk and variability.
Exit Value Insight: In mid-market manufacturing transactions, buyers consistently reward businesses that can demonstrate 18–24 months of disciplined, system-backed KPI improvement with stronger valuation outcomes. The difference between a 5x and 7x multiple on a $5M EBITDA business is $10 million in enterprise value, often driven by confidence in margins, cash flow, operational stability, and data integrity.
These are the pressures that make the right KPIs critical. They give leadership teams the visibility to protect margin, manage cash, stabilize operations, and guide the business confidently toward the next stage, whether that’s organic growth or a liquidity event.
KPIs That Grow Enterprise Value
KPI #1: EBITDA Margin
This is the #1 valuation driver and the clearest indicator of operational health at scale.
EBITDA shows:
- how efficiently the business converts revenue into earnings
- how well costs are controlled as production grows
- how attractive the business is to banks, investors, or future buyers
This is one of the first numbers financial teams, acquirers, and advisors inspect because it reflects the company’s true earning power.
Formula
EBITDA Margin % = EBITDA ÷ Revenue
Where EBITDA = Earnings before interest, taxes, depreciation, and amortization.
A healthy EBITDA margin signals strong cost discipline, predictable output, and a stable cost structure as the business scales.
What to do in your ERP
- Pull accurate COGS, labor, overhead
- Make sure production costs flow accurately into COGS through batch postings
- Ensure overhead rates are applied consistently across all batches
- Keep sales, purchasing, inventory, and manufacturing activity in one system so monthly closes produce clean financials
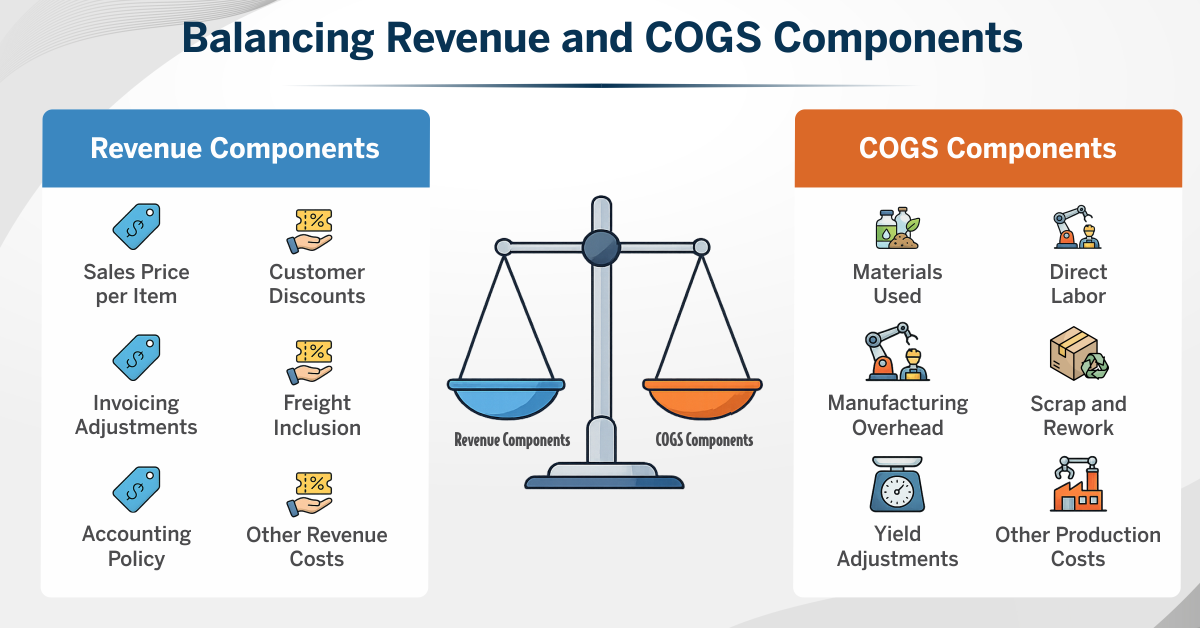
KPI #2: Gross Margin (in general and by product & customer)
The most honest measure of profitability.
Margins tell you:
- profitability of your production operations before overhead
- which products truly carry the business
- which customers dilute value
- which formulas or runs need immediate attention
Formula
Gross Margin % = (Revenue – COGS) ÷ Revenue
Use COGS based on actual material usage, labor, overhead, and scrap.
What to do in your ERP
- Update formulas and BOMs so ingredient and packaging costs are accurate
- Have accurate actual costing, not standard costing guesswork
- Capture actual material and labor usage in each batch
- Review margin by SKU and customer monthly to spot erosion early
KPI #3: Revenue Growth – Trailing 12 Months (TTM)
Provides a view of whether the business is truly growing.
Month-to-month sales can swing wildly in process manufacturing. Seasonal demand, contract timing, customer stocking patterns, and production scheduling all create noise. TTM revenue cuts through that noise and shows the real trend.
It tells you:
- if growth is consistent or masking seasonality
- whether new products or customers are contributing meaningfully
- if customer concentration is increasing or stabilizing
- how well pricing, demand, and capacity align
- whether the business is becoming more valuable over time
TTM is the number leadership teams, lenders, and acquirers trust because it flattens volatility and reveals the direction of the business.
Formula
TTM Revenue = Total Revenue for the Most Recent 12 Months
Example:
If you are in December 2025, add revenue from Jan 2025 to Dec 2025.
This smooths out spikes and dips to show the true growth curve.
What to do in your ERP
- Make sure all sales invoices are posted inside ERP so the revenue timeline is complete
- Review revenue by customer and product to see what is actually driving the trend
Compare rolling 12-month periods to identify whether growth is accelerating, flattening, or declining
KPI #4: Cash Conversion Cycle (CCC)
The fastest way to see how long your cash is tied up in your business.
CCC shows how quickly you turn cash spent on materials into cash collected from customers. When the cycle gets longer, growth slows. When it gets shorter, cash frees up for inventory, production, equipment, and people.
CCC tells you:
- how long cash sits in raw materials
- how long it sits in finished goods
- how long it sits in your customers’ hands
- where the real cash bottlenecks are
- how efficiently the business can fund growth without debt
For many mid-market manufacturers, improving CCC by even 5 to 10 days unlocks hundreds of thousands of dollars in working capital.
Buyers interpret CCC as a reflection of cash discipline and working capital needs.
Formula
Cash Conversion Cycle = DSO + DIO – DPO
Where:
- DSO = Days Sales Outstanding
- DIO = Days Inventory Outstanding (FG + RM combined)
- DPO = Days Payable Outstanding
Lower CCC = faster cash flow, stronger liquidity, and better financial resilience.
What to do in your ERP
- Keep inventory balances and batch consumption accurate so DIO reflects real material flow
- Ensure sales invoices and AR aging reports stay up to date for reliable DSO
- Track supplier payment terms and posting dates to monitor DPO trends
KPI #5: Net Working Capital
A direct measure of how much cash the business needs to operate and grow.
Net Working Capital shows:
- how efficiently cash is moving through day-to-day operations
- whether growth is being funded internally or through external capital
- how inventory, receivables, and payables compound into cash strain
- how much capital a buyer will need to inject post-acquisition
- whether the business is disciplined or cash-intensive
Poor working capital control doesn’t just slow growth but it reduces enterprise value through purchase-price adjustments and increased perceived risk.
Formula
Net Working Capital = Current Assets – Current Liabilities
In most transactions, buyers focus specifically on:
- Accounts Receivable
- Inventory
- Accounts Payable
Cash and debt are typically excluded from the deal calculation.
What to do in your ERP
- Ensure inventory, AR, and AP are fully captured and reconciled inside the ERP
- Monitor working capital trends monthly, not just point-in-time balances
- Tie inventory and receivables decisions back to forecasting, production planning, and customer terms to prevent silent cash buildup
KPI #6: Asset Turnover
A clean measure of how well the business uses its assets to generate revenue.
Asset turnover shows:
- how productive equipment and facilities really are
- how quickly investments return value
- how efficiently the business grows without major capex
- whether underused assets are dragging down valuation
Higher turnover means the company is generating more revenue per dollar of assets, a major indicator of operational and capital efficiency.
Formula
Asset Turnover = Revenue ÷ Total Assets
What to do in your ERP
- Track equipment utilization and depreciation through ERP and accounting
- Compare revenue trends to the fixed asset base quarterly
- Review older or underperforming assets that may require upgrades or retirement
KPI #7: OEE (Overall Equipment Effectiveness)
The clearest measure of how effectively your equipment is running.
OEE shows:
- how much capacity is being lost to downtime
- where performance slowdowns are hurting throughput
- how often quality issues reduce usable output
- whether equipment can support future scale without major capex
- how reliably production aligns with customer demand
Low OEE hides lost revenue, higher operating costs, and premature capital spending, all of which impact enterprise value.
Formula
OEE = Availability × Performance × Quality
- Availability = actual run time vs. scheduled time
- Performance = actual speed vs. ideal speed
- Quality = good units vs. total units produced
What to do in your ERP
- Track machine downtime and causes through shop floor or batch reporting
- Capture actual production speed and output against planned standards
Link scrap and rework data to batch and work center to identify root causes
KPI #8: Inventory Turnover
A clear measure of how efficiently you’re converting inventory into sales.
Inventory Turnover shows:
- how fast materials and finished goods move through the business
- whether inventory levels are supporting or suffocating cash flow
- where excess stock, slow movers, or aging items are tying up capital
- how well forecasting and production planning are working
- how much cash could be unlocked by improving planning discipline
Higher turnover means lower working capital needs, less write-off risk, and a stronger valuation profile.
Formula
Inventory Turnover = COGS ÷ Average Inventory
Higher turns indicate more efficient inventory management.
What to do in your ERP
- Maintain accurate inventory balances with real-time receipts, issues, and adjustments
- Track COGS by product to ensure turnover reflects true material consumption
- Review turnover monthly and drill into slow-moving or excess items before they inflate working capital
KPI #9: Forecast Accuracy
A direct measure of how well your planning predicts real customer demand.
Forecast Accuracy shows:
- how much inventory, cash, and warehouse space are tied up in bad predictions
- whether production schedules are built on facts or assumptions
- how often demand surprises disrupt OTIF and cycle time
- how reliable your planning process is as the business scales
- how much waste, expediting, or overtime stems from poor forecasting
Better forecasting reduces working capital, stabilizes operations, and strengthens enterprise value.
Formula
Forecast Accuracy % = 1 – (|Forecast – Actual| ÷ Actual)
Higher percentages indicate more reliable demand planning.
What to do in your ERP
- Use historical sales and seasonality trends to generate rolling forecasts
- Compare forecast vs actual monthly to identify SKUs with consistent variance
Use forecasting accuracy to adjust safety stock, MRP inputs, and production planning
KPI Benchmarks That Drive Enterprise Value
| KPI | Red Zone (Risk) | Healthy Zone (Typical) | High Performer Zone |
| EBITDA Margin | < 10% | 10–15% | 18–22%+ |
| Gross Margin (by Product & Customer) | < 25% | 25–35% | 35–45%+ |
| Revenue Growth (TTM) | < 4% | 4–8% | 10–15%+ |
| Cash Conversion Cycle (CCC) | > 70 days | 45–70 days | < 40 days |
| Net Working Capital | > 25% of revenue | 15% – 25% of revenue | < 15% of revenue |
| Asset Turnover | < 0.8× | 0.8–1.5× | > 1.5× |
| OEE | < 60% | 60–75% | 80–85%+ |
| Inventory Turnover | < 4 turns | 4–8 turns | 8–12+ turns |
| Forecast Accuracy | < 60% | 60% – 75% | 60% – 75% |
If you can demonstrate 12–24 months of consistent improvement across these KPIs, tracked in a system of record like your ERP, you create a defensible valuation story that buyers trust and reward with stronger multiples.
What ‘s Next?
In Part 2 of this blog series, we’ll focus on the KPIs that protect enterprise value, the metrics buyers use to evaluate risk, reliability, and valuation resilience.
Together, both parts form a complete KPI framework for manufacturers who want to grow confidently and hold their value under scrutiny.